
JavaScript debugging done right!
I think everyone has encounter a bug in his life - not the natural, but the real one - the code one. Like really, even the most experienced programmers need to watch out for bugs. These are such easy-to-do and nasty things, that you can consider yourself lucky if you haven’t ever had one in your code-base. With that said, it’s natural that advanced programmers have fewer bugs than beginners. You know why? Because they know the right techniques to prevent them from happening!
The process of debugging is present in the very nature of programming. Especially in dynamically-typed languages like JavaScript. That’s why, in this post, instead of me convincing you to use TypeScript for 5 min straight, we’ll take a look at some of the possible debugging techniques. Just keep in mind that they sadly won’t help you make fewer bugs in the first place, rather than just improve the process of debugging/fixing the already present ones. So, let’s get started!
Console.log()
The first thing that comes to the mind of every JS developer, when he hears the word “debugging” is - most likely - console.log(). Just think - how many times, when a bug happened, you just put a series of console.log() in your code, and analyze the output? Well, I would argue, that it’s the most popular technique used in JS debugging, and maybe the only one that a lot of programmers know and use. And, guess what? - That’s actually quite fine. Given that console.log() is easy to use and understand, can be placed anywhere in your code, and - given that you develop your project in HMR-enabled environment - enables you to smoothly debug the issues on-the-go. Another thing contributing to that is the fact that console.log() is only one method, besides almost a dozen of others, that together form diverse Console API, covering a lot of programmer’s possible needs (I’ve written about all of them in one of my previous articles).
console.log("bug!");
console.table(["bug!", "bug!", "bug!"]);
console.assert("bug!");
console.trace("bug!");
// ...
But, the need for continuous interference in the code-base, the possible need for re-transpilation, no HMR support at worst, together with some smaller issues, leave us striving for a better way to debug our code. So, how to debug without console.log()?
DevTools
As it turns out, it appears that there indeed is a better solution - with the help of DevTools. You definitely use these quite often, but most likely only to check the logs or mess a little bit with HTML or CSS. You probably know that this set of tools can do a lot more than that, don’t you? But, the feature I’d like to talk about are the so-called “breakpoints” - another popular debugging technique.
For the purpose of this article, I’ll be using Google Chrome, as there’s almost 80% chance that you’re using it too. But, the process should look at least somewhat similar in other browsers. So, let’s F12 to our DevTools now. There, go to “sources” panel. Here, if you haven’t changed the default layout yet, you should see a file navigator, code editor, the console on the bottom, and the debugging pane, which is our main focal point.
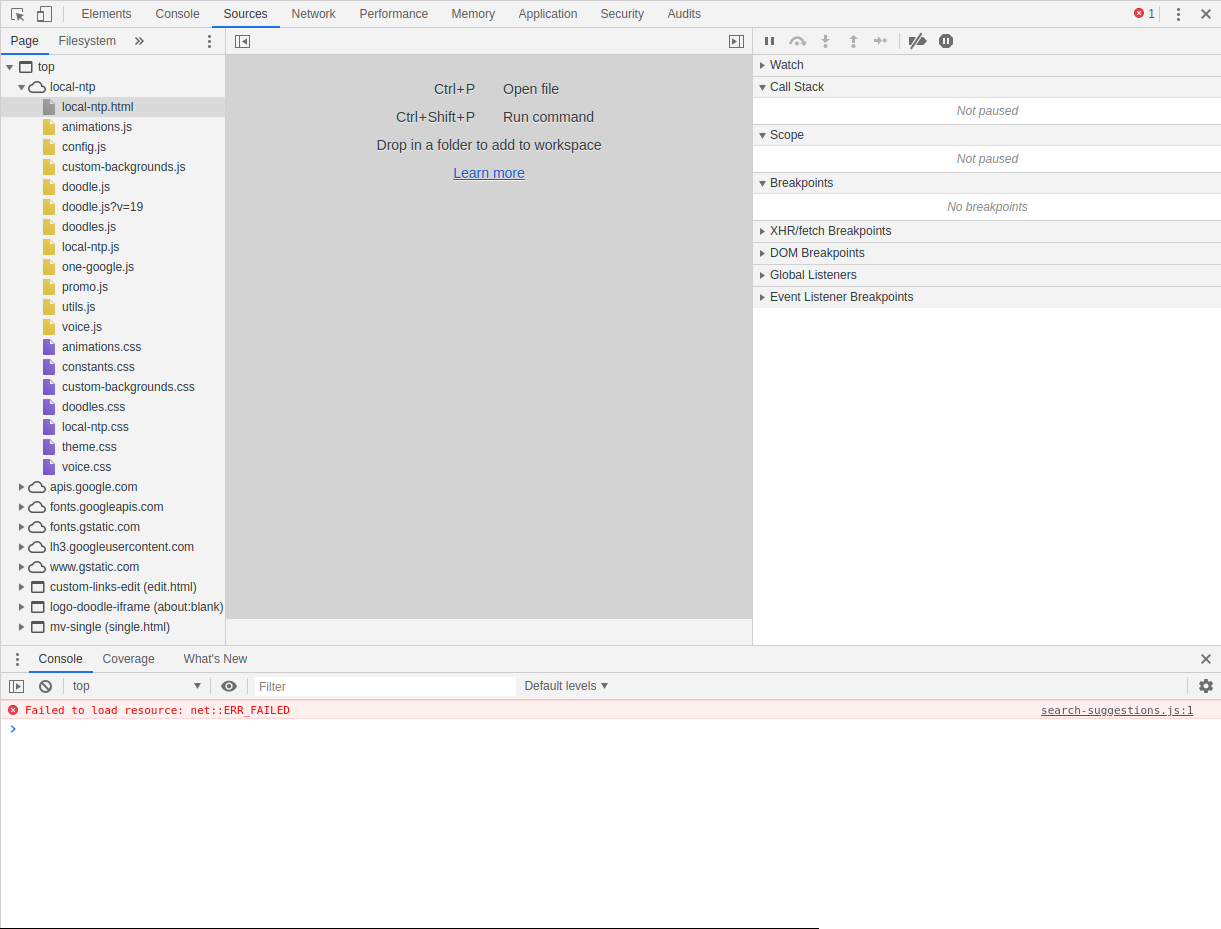
Now, if the term “breakpoint” doesn’t mean anything to you, here’s a simple explanation. It’s a point in the code, where you’d like to stop its execution (“break it”) and make your analysis and debugging. Simple, but quite powerful! Let’s have a look…
First what we need to do is selecting our breakpoints. We can do it from the code editor pane, by selecting the numbering of the line that we want to stop the execution process. You can also use the debugging pane itself to place breakpoints at selected event listeners and turn any of them on and off. It’s a pretty easy and painless process.
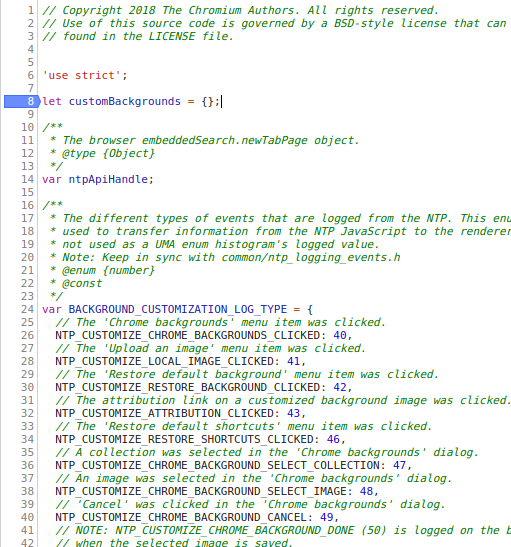
To start working with your breakpoints, you have to re-execute the code, most likely by just refreshing the page. After this is done, all your breakpoints will stay in place and get activated. When the given line of code (LOC) will be reached, the execution process will stop.
From there you can do all sorts of stuff. You can inspect your current call stack (all functions and stuff needed to be executed to get to the current LOC), run custom expressions, check all values available in the current scope (whether it’s local, global or whatever), and do it all for any thread (when using Web Workers). You must agree - that’s definitely a bit more than console.log() can handle.
Controlling and walking through your breakpoints is also easy. All you need is the controls bar on the top of debugging pane, with a few buttons inside it. Here you can move through your breakpoints, start and pause code execution, and even go through your code expression by expression. Each button has an informative icon and tooltip assign to it, so you’ll always know what to use.

VS Code
So, I think we can all agree that DevTools and breakpoints are cool. But, what if we want to do the debugging right from our beloved, most popular code editor - VS Code? Well, guess what? - It’s quite easy too!
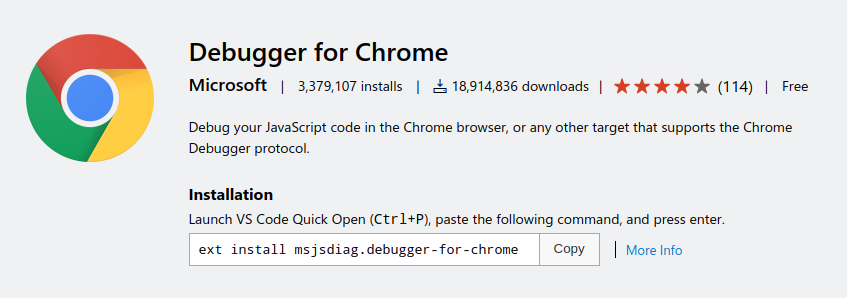
To get started, we’ll need to install an extension called Debugger for Chrome. This will allow us to properly debug our JS apps, with the help of Chrome browser.
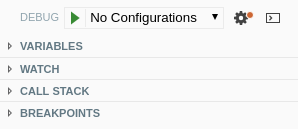
With the extension installed, we now need to go to the debug panel inside the editor. There, we’re greeted with a pretty neat UI, basically providing the same functionality that DevTools does but in a slightly different package.
Then, we have to create our debug config. For this purpose, use the gear icon and choose the Chrome environment. A new launch.json file will be placed in the .vscode directory. Inside it, we can specify the number of different debug configurations. As the comment in the generated file indicates - let the autocompletion feature be your guide. With that said, here, we’re going to create a small, but comfortable config for our use.
Let’s say that we have an NPM start script setup and ready to go. We have a pretty standard, HMR-enabled environment that serves our app on localhost. Take a look at the corresponding config file:
{
    "version": "0.2.0",
    "configurations": [

        {
            "type": "chrome",
            "request": "launch",
            "name": "Debug Chrome",
            "preLaunchTask": "npm: start",
            "url": "http://localhost:4000",
            "webRoot": "${workspaceFolder}"
        }
    ]
}
Here, what we’re basically doing is executing the given npm start script before running the debugger (notice the syntax), which we later run for localhost port 4000. That’s how simple the configuration process really is!
In order to run the debugger, you need to first select your breakpoints. This time it can be done inside the editor, by clicking next to the line numbering. After that, just pick the right config, click the start button, and the new Chrome window will be opened. From this point on, you can control the code execution and debugging process from either opened window’s DevTools or in the VS Code itself! Keep in mind that for debugging to work after hot reload, you’ll need to reload the debugger first.

Now, using the debugger through VS Code you’ve got some additional options available when compared to standard DevTools. It’s especially true, considering the NPM scripts and preLaunchTask property that we’ve used before. By utilizing these you can easily pre-configure and customize your debugging process. In my case, the most useful thing I did was TypeScript compilation. If you want to use TypeScript with VS Code debugger, just don’t forget about setting the sourceMap property to true in tsconfig.json. It’ll drastically improve your debugging experience!
Node.js
By this point, we pretty much covered all stuff that may be useful in everyday debugging of web apps. But what about the popular Node.js runtime and the code using it? How to debug this kind of things?
Debugging Node.js apps can be simpler than you think. For example, you don’t have to deal with the whole browser here! But, let’s for a moment assume that you don’t really want to debug right now, rather than have this nice, expandable and interactive console logs that standard DevTools provide. Believe me or not, if you’re using console.log() and similar things with complex, big structures like objects, things can start to look bad pretty quickly, when operating in the terminal.
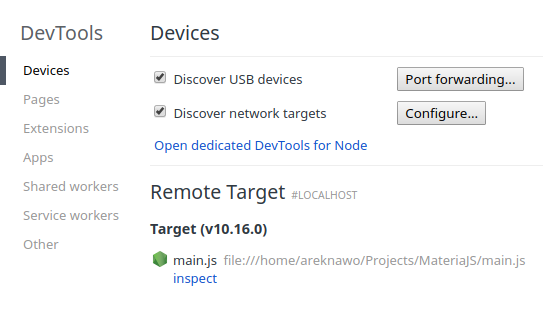
The good news is that, from quite a few Node.js versions back now, you can actually pass the --inspect flag and you’re pretty much ready to use DevTools as your console output.
node --inspect main.jsJust go to about:inspect in your browser, and you should see the remote target available for debugging.
That is unless your app didn’t close immediately after it executed all the code. If this is a case, use put this LOC in your code, in order to make sure the program doesn’t exit right when its execution ends.
process.stdin.resume();Of course, this technique only allows you to make your logs feel nicer, but not necessarily debug them in any form or way. For this purpose, we’ll need to get back to the VS Code and see what we can do!
As it turns out, VS Code comes with Node.js debugger pre-installed, and that’s what we’re going to use. Just add another configuration object to our configurations array and we should be done…
{
    "version": "0.2.0",
    "configurations": [
        {
            "type": "node",
            "request": "launch",
            "name": "Debug Node.js",
            "program": "${workspaceFolder}/main.js"
        },
    ]
}
So, as you can clearly see, there’s a different type for our config equal to "node", and a new program property which points to our main.js file. From there, you can run the debugger and do all the sorts of stuff you could do in the previous example. Only this time there’s no external browser window opened and you have to deal with what the VS Code has to offer… unless you combine it with the --inspect technique.
Best way to debug?
We’ve explored the most basic and general way of debugging your code - through Console API or with the use of breakpoints - in two environments that a web developer mostly uses - a browser and a code editor. But, how should you really debug your code?
These two ways of debugging are generally all there’s to it. Additional features only improve upon them. That’s why functionalities of e.g. breakpoints can vary depending on your environment. With that said, breakpoints are almost always the better way. They don’t interfere with your code-base directly and provide much more info with a simple selection. Of course, Console API is still useful, especially when working with some smaller code snippets or doing some “dirty” stuff.
If this tip doesn’t do it for you, I have a better one! How about… not creating bugs in the first place? Yeah, kind of unrealistic. But, by following good coding practices, constantly testing your code and ensuring its general high-quality standards, you can at least minimize the chances of having to debug a bug. That’s something that we’ll definitely be exploring in the upcoming posts on this blog…
Opinions?
So, I know that this article may feel pretty basic, or even too beginner-friendly (if such thing even exist). But, that’s what the intended audience for this post i - beginners. Those who are eager to learn new things and… debug stuff. But also, if you’re an experienced programmer, maybe this article just made you think about how often you use Console API instead of some alternative, possibly better options?
As always, if you like the post and this blog, consider leaving a comment or a reaction below. Also, consider following me on Twitter, on my Facebook page or through my weekly newsletter for more content like this. And, guess what? - Have a “bugless” day!
If you need
Custom Web App
I can help you get your next project, from idea to reality.