Top 10 Chrome DevTools tips & tricks
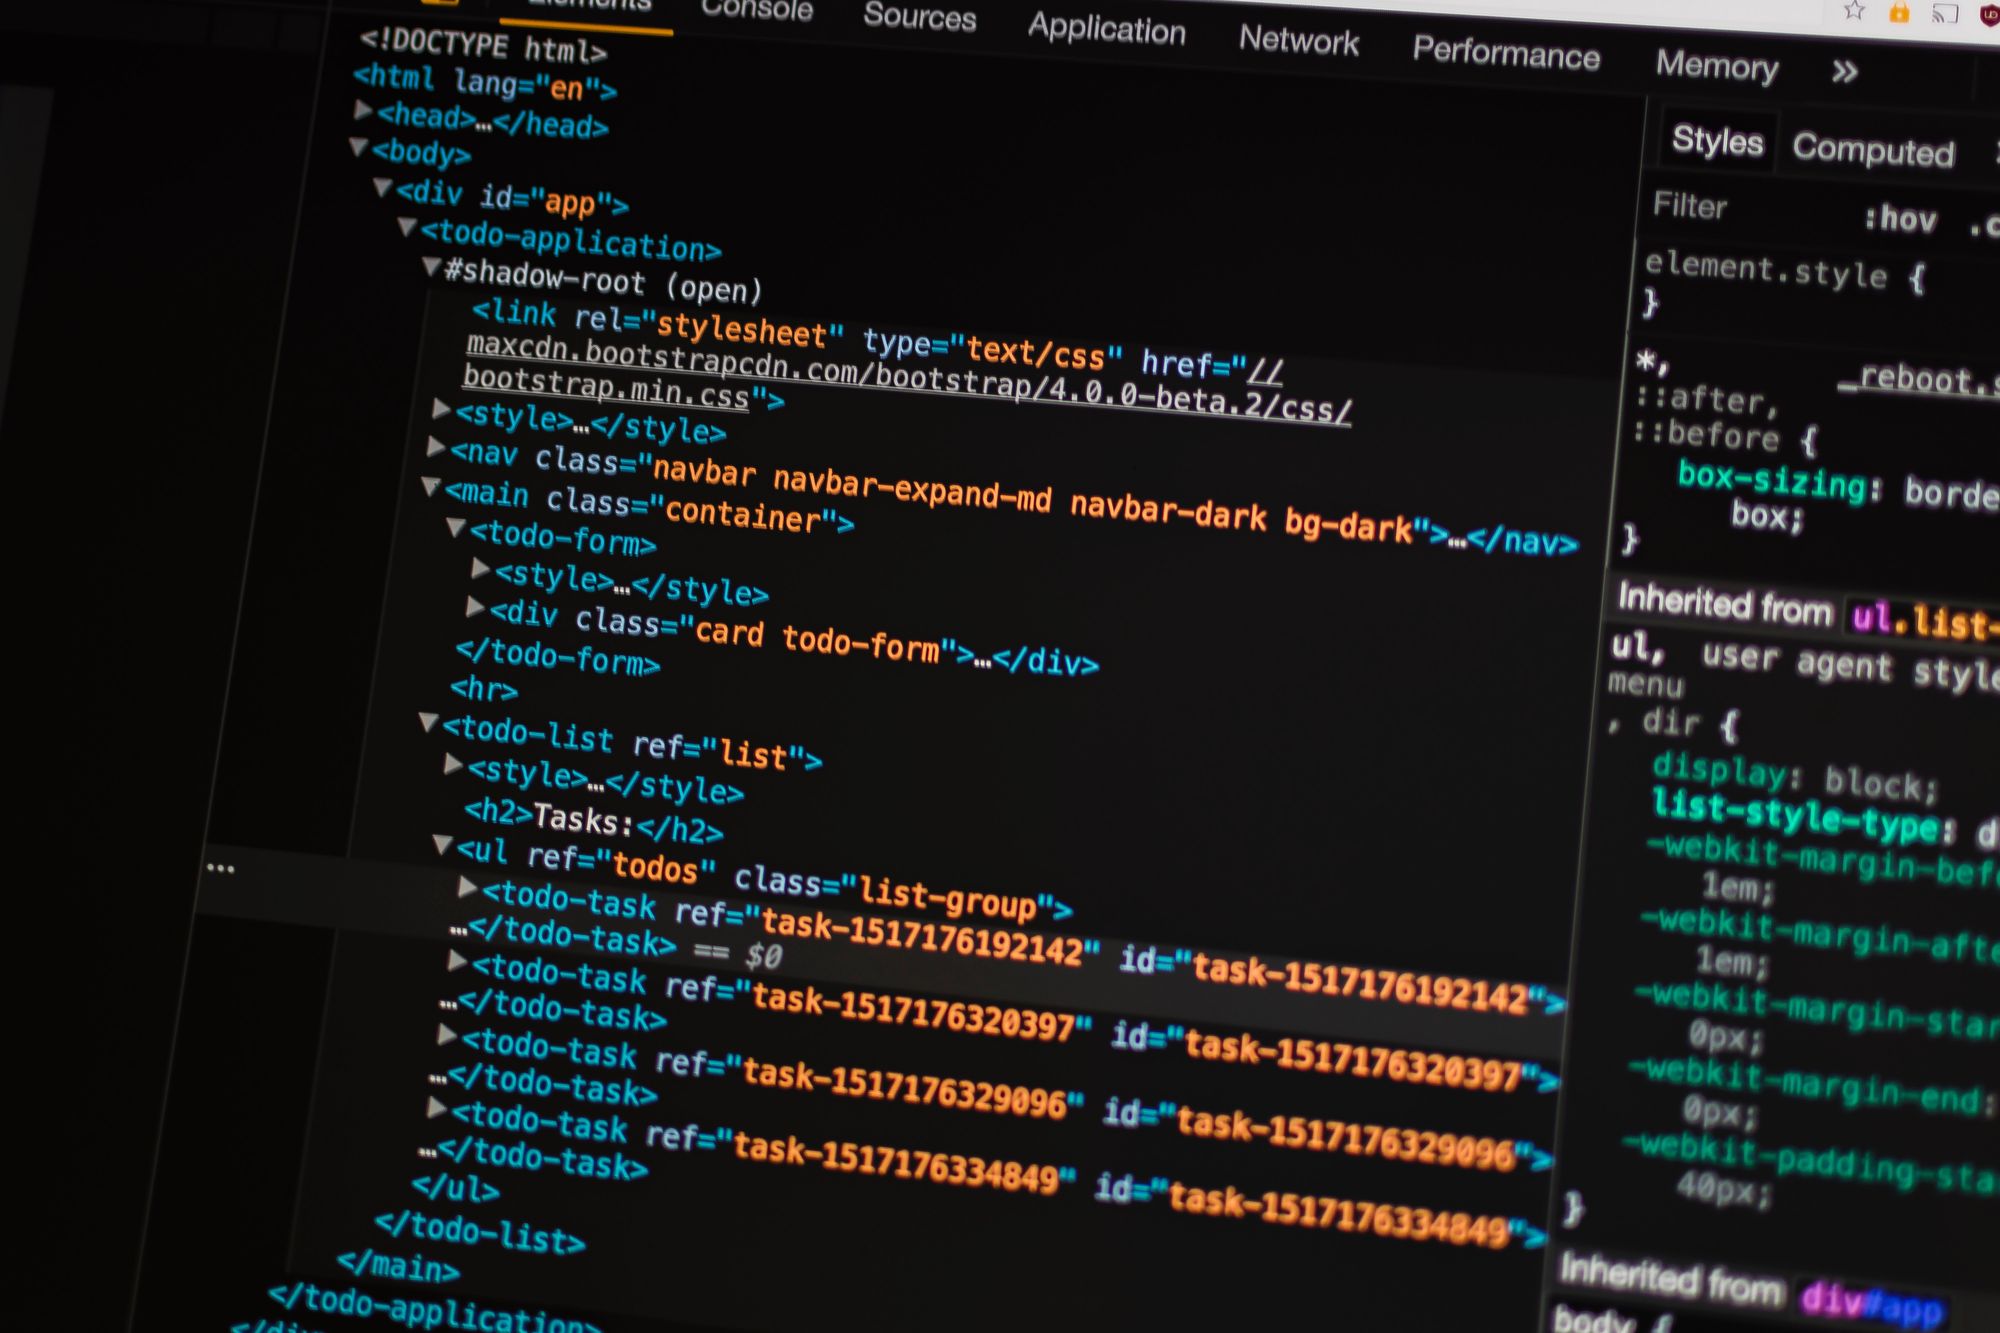
DevTools are undoubtedly one of the most important tools in a web developer’s toolbelt. Definitely the go-to (and pretty much only) way for front-end debugging.
From all the browsers, and all the DevTools variations (most notably 3, to be precise), Chrome DevTools are the most popular. They help you debug your code across many Chromium-based browsers like Chrome, Edge, or Brave - and even more other Chromium-based projects.
So, you’re most likely familiar with the basic DevTools workflow. Click a button or press a key, and you’re in. From there, you’ll most likely end up checking the console, playing with some JavaScript and DOM, and maybe inspect the network requests or storage tab. That’s all pretty much the same across browsers.
However, did you know that at least Chrome DevTools have many commonly unknown features that can save your dev life or, at the very least, smooth your workflow? Well, if you didn’t, here’s 10 of them!
1. Freezing
We’re starting with a banger!
Have you ever been in a situation where, e.g., you needed to test the hover behavior of a component on your website, but it was controlled by JS, so no CSS → Toggle Element State available? You also can’t move your pointer from the element, as it’ll revert to default behavior.
So, you’re stuck, and the only solution is to edit the code, which can become cumbersome pretty quickly for a quick check like this. So is there another solution?
Turns out there is - a keyboard shortcut for pausing with the debugger! Just open your DevTools, go to the Sources tab, trigger the state anyway you need to, and hit F8. You should now be in the debugger, and your state should be left frozen!

2. Command palette
Next up, we’ve got something big, though somewhat hidden. Did you know DevTools have their own command palette? It can be triggered by Ctrl Shift P (just like on default VS Code config!) or from the vertical three-dot (Customize and control DevTools) menu → Run command.
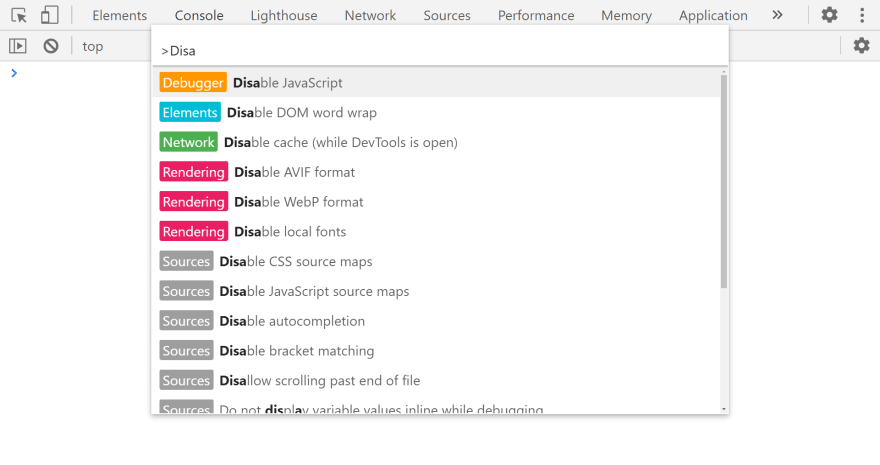
Command palette has many great shortcuts that you’ll learn as you get more comfortable with it. My personal favorites are again related to the debugger - Disable JavaScript and Enable JavaScript.
3. Emulation
It’s no secret that DevTools are full of emulation tools. Most likely, you know and have used the network throttling tools (Network → Top Menu bar → No throttling Dropdown menu) or “device toolbar” (on the left of DevTools tabs). But of course, there’s more!
Again from the vertical three-dot menu → More Tools → e.g., Rendering or Sensors. You can also use the command palette if you know what you’re looking for.
In the opened Rendering drawer, you can control some debugging rendering toggles and emulate CSS media stuff. You’ll most likely check in here when you’ll be developing auto dark mode (prefers-color-scheme).

The Sensors drawer is a bit more extraordinary. You’ll use it for emulating advanced mobile device features like location or idle state. There’s even a nice 3D editor (with what looks like Pixel 3 XL with the mother of all notches 😅) for setting the orientation for things like the Gyroscope API!

4. Customization
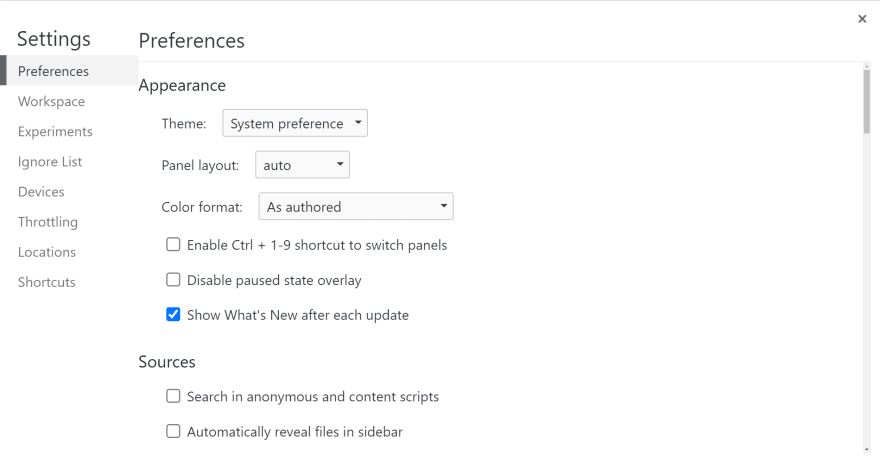
This might be one of the simplest tips, but did you know that DevTools have their own settings panel (F1 or the Settings cog icon on the left of tabs)? Shocking, I know.
The thing is, most devs, most of the time, don’t have a need to open settings, and so they don’t really know how much good stuff is in there. UI customization, dark mode, experimental features, throttling profiles, shortcuts, and more - DevTools settings are an absolute gold mine of options. Experimenting with them and tweaking them to your needs will definitely result in a better experience!
5. Multi-line editing
If you’re a web developer long enough, there’s a high chance you sometimes want to just play with some JS or mess with a specific website design. Code playgrounds like CodePen or CodeSandbox will probably be a better choice in the first scenario, but they still take some time to load, and you need to explicitly go to their respective websites first. DevTools console is just much quicker and much more versatile.
However, there’s no discussion that its multi-line editing is trash. Having to Shift Enter all the time is a recipe for frustration and crippled productivity. But, there is another way!
Go to Sources → left drawer → optionally double arrow in “sub-tabs” → Snippets. There you’ve got something like DevTools dedicated coding playground! Just click New snippet and start writing! When you’re done, you can run your snippet or even format it if you want.

Granted, the DevTools snippet editor isn’t all sunshine and rainbows. The editing experience is far from what you get in modern code editor/IDE, formatting can’t be configured, and without IIFE, you’ll pollute and potentially run into conflict with the global scope.
Still, a great option for quick multi-line snippets!
6. Live expressions
Next up, also something related to quick code experiments.
Live expressions allow you to run quick, usually, single-line pieces of JS “live”, meaning continuously updating. You’ll best see it if you enter something like Math.random() - it’ll constantly be outputting different values until you clear the expression!
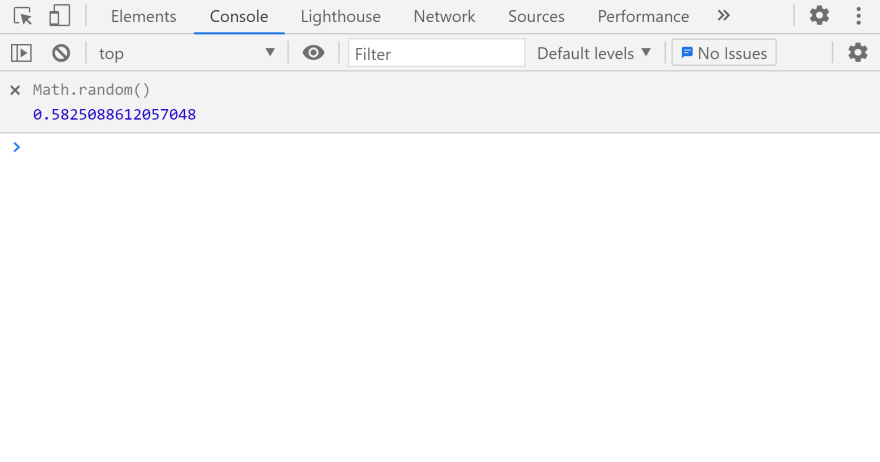
To use live expressions, you should go to the console tab, and click the eye icon button (Create live expression) and enter your expression in the opened editor (use Shift Enter for multi-line)
Now, I, for once, often use it to see the current number of elements on the website and when/how it updates (document.querySelectorAll("\*").length), but there’s surely more expressions you’d want to watch continuously.
Just remember not to enter too complex code in there, as running it constantly could bring your machine to its knees!
7. jQuery shortcuts
You almost certainly have played with DOM elements in your console. Before that, you had to access the desired DOM element. You could do that with JS DOM API like document.getElementById(), or through right-click on the element in DOM inspector → Store as global variable. But did you know there are more efficient, jQuery-style ways of doing it?
Granted, jQuery might not be the most favorable JS library these days, but its $() function is undoubtedly versatile. So, it’s good that you can use it in your console without even touching jQuery!
In the DevTools console you’ve got multiple $ shortcuts:
$()as an alias fordocument.querySelector()$$()as an alias fordocument.querySelectorAll()$0to$4for from the last to fifth selected element in DOM inspector$\_for the value of last executed operation
As you can see, there’s quite a lot of these useful shortcuts! So, if you get past the force of habit, here you got a great way to speed up your workflow!

8. Screenshots
There are many ways to do screenshots. But unless you want to capture the entire screen or window, there’s a high chance your screenshot won’t be perfectly lined up. Thankfully, at least when it comes to web pages, DevTools have many tools for that!
So, there are as many as 4 types of screenshots you can do with DevTools alone:
- Screenshot (standard) - just the screenshot of the current view
- Area screenshot - screenshot of the selected area of the webpage
- Node screenshot - screenshot of the selected node
- Full size screenshot - screenshot of the entire website (all the scrollable content)
The easiest way to do pretty much any of the screenshot types listed is to search for “screenshot” in the command palette - all options are there. For node screenshots, you can also right-click in the DOM inspector → Capture node screenshot.

Now, I’ve got an additional tip for you! If you’ve ever had to take high-resolution screenshots for e,g product showcases or articles, then DevTools also got you covered!
Go to Settings → Devices → Add custom device, and enter Full HD resolution with 4 as device pixel ratio. This way, you get an 8K screen device!
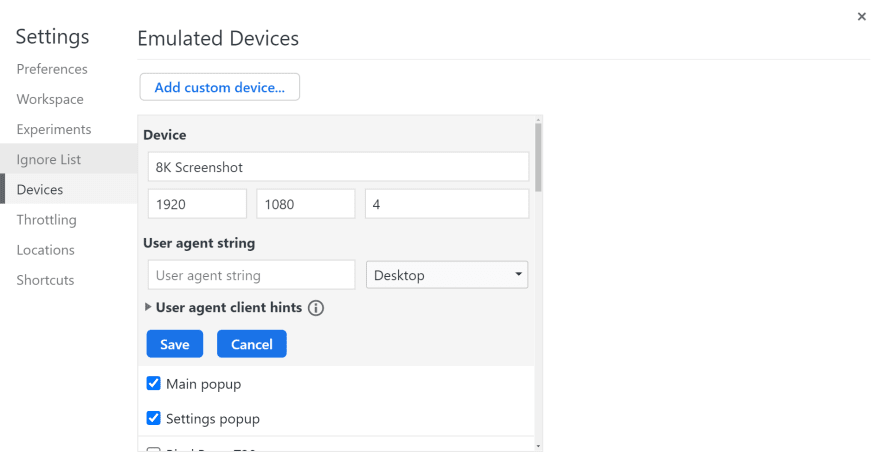
Then, with the device toolbar on, activate the 8K device preset, and take a screenshot (either through command palette or from the vertical three-dot menu on the right (More options).
It might be spotty, and depending on your machine, can freeze if you go higher than 8K, but it’s a great way to take screenshots of higher resolution than your screen!
9. Design mode
This one’s pretty cool! Did you know that there’s a design mode flag that makes your entire website editable?! Like contenteditable style!
It’s similar to setting contenteditable attribute on your root <html> element, but a bit cleaner, without affecting the DOM.
When in console, just set document.designMode to ”on”, and you’re done! Feel free to play around with deleting/adding text, removing images, and so on! When you’re done, just set the same property to ”off” and seal your work.
10. Custom formatters
Last but not least, we’ve got custom object formatters. These let you do some crazy stuff to nicely format your cryptic or complex objects.
To enable custom formatters, go to Settings → Preferences → Console section → Enable custom formatters. From now on, you can use custom formatters by using libraries that support them or by defining them yourself through the window.devtoolsFormatters property.
window.devtoolsFormatters = [
  {
    header(obj) {
      if (obj.msg) {
        return ["div", { style: "color: white; background: orange;" }, obj.msg];
      }

      return null;
    },
    hasBody(obj) {
      return Object.keys(obj).length > 1;
    },
    body(obj) {
      const { msg, ...otherProperties } = obj;

      return [
        "div",
        ["div", "Other properties:"],
        [
          "div",
          { style: "margin-left:8px;" },
          ["object", { object: otherProperties }],
        ],
      ];
    },
  },
];
devtoolsFormatters is an array of formatter objects. These contain 3 methods: header() for rendering the main message (use null to leave object unaffected), hasBody() to determine whether the object can be expanded, and body() for rendering the object’s expanded form when required. The values returned from header() or body() should be in JsonMl format (essentially JSON representation of HTML). As for what the above gets you:

If HTML or CSS in the DevTools console sounds weird to you, you should read one of my older posts, where I go into details about different console logging methods and their stylings.
Overall, custom formatters are a pretty complex topic on their own, maybe even deserving their own blog post (let me know if you want to see it).
11. Use BetterConsole
If you’ve got this far, I’ve got a special bonus tip for you - use BetterConsole!
I’ve covered it in-depth in my previous blog post, but in general, BetterConsole is my project, meant to fix some of the small but infuriating issues related to the DevTools console that you have to deal with all the time.

So, instead of a separate window or drawer compromising your window size (especially on a small screen), you’ve got a bubble + card combo - freely resizable and draggable within the whole viewport! You’ve also got a built-in multi-line editor with VS Code-level editing experience, including intellisense, code suggestions, code folding, and more!
Beyond that, there’s TypeScript support and SCSS support - with a dedicated panel for injecting stylesheets and DOM elements right from the console. Oh, and you can use the Prettier integration to format your code beautifully.
Essentially, a coding playground, but for every website, right under your mouse pointer. Sure, it doesn’t have as many features as DevTools themselves, but it’s a much better experience for what you’re doing in your console most of the time.
And the best part is - beta phase is coming soon! With it, you can help me develop the best console experience possible and get a chance not only to try but also get 100% off - free - the final product!
So, if you’re interested, feel free to check out the project’s Twitter page and join the Discord server to be among the first beta-testers!
Bottom line
So, as you can see, Chrome DevTools are full of useful and interesting stuff. Tips and tricks in this post are just 10 of many, which you can find in DevTools!
But, even if you’re not looking for anything more in the DevTools console, you’ll certainly enjoy BetterConsole’s flexibility, TypeScript support, and multi-line editing experience. So, join the beta Discord server now, and follow BetterConsole on Twitter for updates.
For more web development content, follow me on Twitter, Facebook, or through my newsletter. Thanks for reading, and happy coding!
If you need
Custom Web App
I can help you get your next project, from idea to reality.